
Affichage des articles dont le libellé est information visualization. Afficher tous les articles
Affichage des articles dont le libellé est information visualization. Afficher tous les articles
vendredi, avril 01, 2011

jeudi, mars 17, 2011

jeudi, mars 03, 2011

lundi, février 14, 2011

vendredi, janvier 21, 2011

samedi, janvier 15, 2011
HTML5 & CSS3 READINESS
Here is an interestzing way of displaying information I found at http://html5readiness.com/
Click on the image below to dynamically see data:

Click on the image below to dynamically see data:
vendredi, janvier 07, 2011
Dimensions Treemap using Protovis
Based on Treemap from protovis design in javascript, I have now a treemap with 3 dimensions.
Click on the image below to see it in action (because my post does not allow it to be dynamically displayed).

3 Dimensions are:
Click on the image below to see it in action (because my post does not allow it to be dynamically displayed).
3 Dimensions are:
- definition of groups that share the same kind of color
- each square with it's area
- each square is more or less dark and more or less saturated
- The yellow group of color could group all keyboard projects.
- square area is proportional to the total number of bugs for this project
- square darkness and saturation/alpha is proportional to the number of open bugs for this project
lundi, décembre 27, 2010
Chinese language to dominate the internet

What is interessant in the format of this visualization is earth at the center that stresses the fact that we are talking about world wide statistics.
We can also notice how internet growth in China is presented as a subset of the first graph.
vendredi, octobre 29, 2010
A history of world GDP
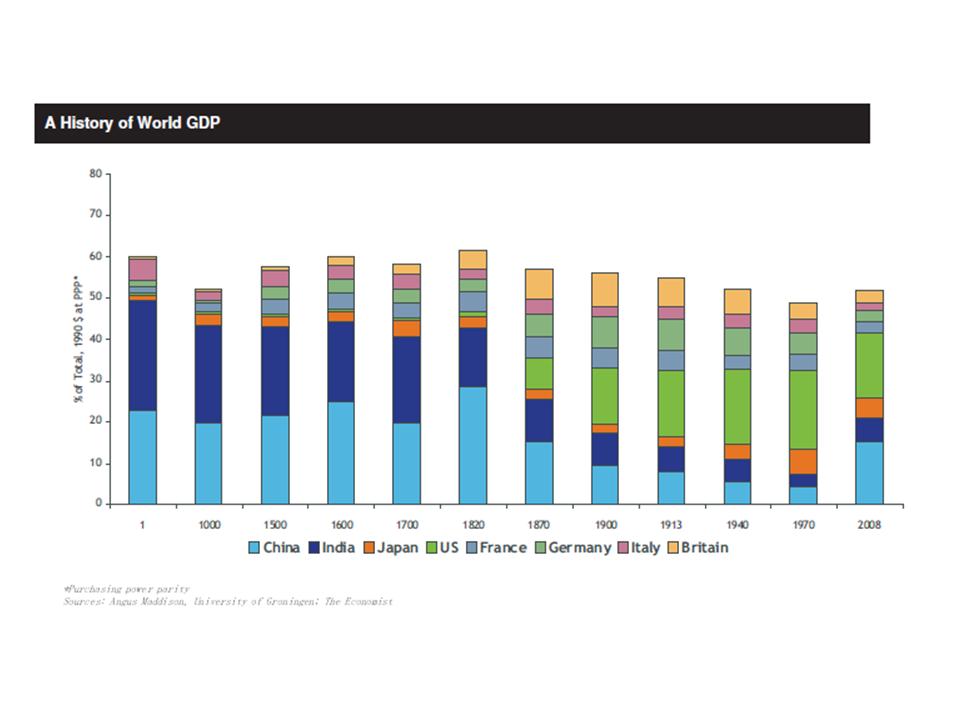
What would have been good is to have a definitions of the countries boudaries accross time. Anyway it gives a good idea of the trends.
lundi, juillet 28, 2008
An enhanced TreeMap Applet

TreeMap is a way to present information that is very efficient sometimes...
This TreeMap Applet has been enhanced with custom colors and comments using 2 additional xml fields to the standard xml description:
- details for comments when clicking on squares.
- hue / color for discriminating between main groups of squares.
Inscription à :
Articles (Atom)